Using Side-Scan Sonar instrument to Characterize and map of seabed identification target in punggur sea of the Riau Islands, Indonesia.
DOI:
https://doi.org/10.24273/jgeet.2017.2.1.11Keywords:
Punggur Sea, Seabed Identification, Side Scan Sonar (SSS), Gain (dB), Altitude (m)Abstract
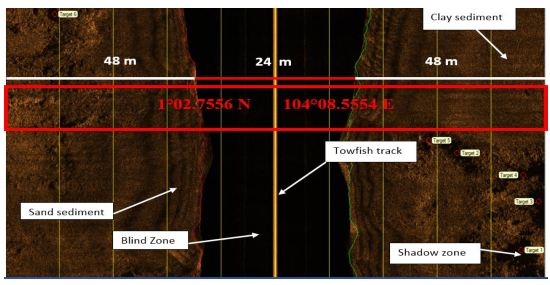
Punggur sea has many habitats, object, and structured of seabed with hight tide and wave. Side scan sonar is an underwater acoustic instrument for identification of seabed. This research aims to classify types of seabed and measure seabed identification into the sea water with grain size (dB), location, altitude (m) and target using side scan sonar instrument. This research also uses one types of side scan sonar in one places with 3 line of collecting data to get more variant seabed. Side scan sonar data of 20 km of side-scan sonar profiling (CM2, C-MAX Ltd, UK) with altitude max 20 m and a working acoustic frequency of 325 kHz with the zone is taken in the punggur sea (104°08.7102 E, 1°03.2448 N until 1°03.3977N 104°08.8133 E). The data side scan sonar processed using max view software to display the image of the seabed. Results of seabed imagery in the punggur sea on track 1 have Objects found on the ship coordinates 03.3101N 1 ° and 104 ° 08.7362 E with the highest gain value is 6 dB, altitude 18 m on ping 75. Linear regression has y = 0.7016x+12.952 with R2 = 0.4125 (41%). Track 2 has target 1 is the sunken object on the seabed, while objects in the form of sand can be seen clearly. Objects found on the sunken object coordinates 1°02.8143 N ° and 104°08.5228 E with highest gain value is 9 dB with altitude 17.7 m and data ping 69. Linear regression has y = 0.2093+12.577 with R2 = 0.2093 (20%). Track 3 has Target 1 is the ship object on the seabed, while objects in the form of sand can be seen clearly. Objects found on the sunken object coordinates 1°02.5817 N and 104°08.7337 E with the highest gain value is 8 dB with altitude 16.5 m and data ping 3984. Linear regression has y = 0.5106x +12.84 with R2 = 0.5106 (51%). Track 1 has many targets identification results compared Track 2 and 3.
Downloads
References
Collier JS dan CJ Brown. 2005. Correlation of Sidescan Backscatter with Grain Size Distribution of Surficial Seabed Sediments. Journal of marine geology, geochemistry and geo physhics (214). 431-449.
Diaz, D., Cuevas, K., Buchanan, M., Gordon, S., & Perret, W. S. 2002. Side scan sonar in oyster management. In OCEANS'02 MTS/IEEE (Vol. 1, pp. 141-145). IEEE.
Kenny AJ, Cato I, Desprez M, Fader G, Schüttenhelm RTE dan Side J. 2003. An Overview of Seabed Mapping Technologies in the Context of Marine Habitat Classification. ICES Journal of Marine Science (60): 411-418.
Lubis, M. Z., & Anurogo, W. 2016. Fish stock estimation in Sikka Regency Waters, Indonesia using Single Beam Echosounder (CruzPro fish finder PcFF-80) with hydroacoustic survey method. Aceh Journal of Animal Science, 1(2).
Lubis, M. Z., S. Pujiyati. 2016. Detection backscatter value of mangrove crab (Scylla sp.) using Cruzpro Fishfinder Pcff-80 hydroacoustic instrument. Journal of Biosensor and Bioelectronic, 7(2): 1000205.
Lubis, M. Z., Wulandari, P. D., Mujahid, M., Hargreaves, J., & Pant, V. 2016. Echo Processing and Identifying Surface and Bottom Layer with Simrad Ek/Ey 500. Journal of Biosensors and Bioelectronics, 7(3), 1000212.
MacLennan DN dan Simmonds EJ. 2005. 2th Fisheries Acoustic: Theory andPractice. Oxford (UK): Blackwell Science.
Medwin, H., & Clay, C. S. 1998. Fundamentals of Acoustical Oceanography Academic. New York, 24.
Medwin, H., & Clay, C. S. 1998. Fundamentals of Acoustical Oceanography Academic. New York, 24.
Mitchell, N. C., & Somers, M. L. 1989. Quantitative backscatter measurements with a long-range side-scan sonar. IEEE Journal of Oceanic Engineering, 14(4), 368-374.
Sari SP dan HM Manik. 2009. Deteksi dan Interpretasi Target di Dasar Laut Menggunakan Instrumen Side scan sonar. Seminar Nasional Teori dan Aplikasi Teknologi Kelautan. 25-30.
Somers, M. L., Carson, R. M., Revie, J. A., Edge, R. H., Barrow, B. J., & Andrews, A. G. 1978. GLORIA II—An improved long range sidescan sonar. In Oceanology International (Vol. 78, pp. 16-24).
Urick RJ. 1983. Principles of Underwater Sound. 3rd ed. New York (US): Mc-Graw-Hill.
Downloads
Published
Issue
Section
License
Copyright @2019. This is an open-access article distributed under the terms of the Creative Commons Attribution-ShareAlike 4.0 International License which permits unrestricted use, distribution, and reproduction in any medium. Copyrights of all materials published in JGEET are freely available without charge to users or / institution. Users are allowed to read, download, copy, distribute, search, or link to full-text articles in this journal without asking by giving appropriate credit, provide a link to the license, and indicate if changes were made. All of the remix, transform, or build upon the material must distribute the contributions under the same license as the original.