Evaluation Study of Boundary and Depth of the Soil Structure for Geotechnical Site Investigation using MASW
DOI:
https://doi.org/10.24273/jgeet.2017.2.1.21Keywords:
MASW, dispersion Curve, Phase velocity, Wave number, WavelengthAbstract
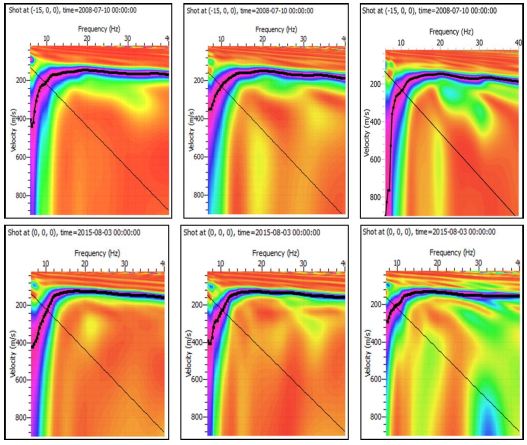
This study reviews the correlation between the experimental Rayleigh dispersion curve and the Vp & Vs ground model versus depth. Six samples of stations A , B , C , D , E and F were used in the experiment.The geophone spacing used was set 1 m and total length of each line was 23 m. The result shows positive significance (best fit) of R2 that ranges from 0.80 to 0.90. The fk (frequency-wave number method) dispersion curves analysis confirmed that the soil structure investigated is divided into three zones: (1) Unsaturated soil zone (clay soil), in which the layer is dominated by soil with typically alluvial clayey silt and sand. The Vp ranges from 240 m/s to 255 m/s at a depth of 2 to 8 m. (2) The intermediate zone (stiff soil), in which the layer is dominated by sand, silt, clayey sand, sandy clay and clay of low plasticity. This structure is interpreted as partially saturated soil zone, the soil is typically very dense. It contains soft rock typically fill with cobble, sand, slight gravel and highly weathered at depth of 18 to 30 m with Vp of 255 to 300 m/s. (3) Saturated soil zone at a depth of 8 to 18 m with Vp of 300 to 390 m/s. There is a very good agreement between wave-number (k) and phase velocity (Vw) produced. Both the two parameters shows similar pattern in the topsoil and subsurface layer, which constitute boundary field of soil structure. Moreover, relationship between phase velocity versus wave-length shows best fit of model from inversion with measured value (observed) in implementation of the boundary and depth of each layer.
Downloads
References
Babusk,V. and Cara, M. ,1991. Seismic Anisotropy in the Earth , Modern Approaches in Geophysics, Volume 10 , ISBN: 978-94-010-5596-3, Springer Science & Business Media.
Blake, D.R., 2009. Surface layer thickness and velocity determined using the Multi Channel Analysis ofSurface Waves (MASW) method compared with microtremor resonance analysis Federal Road, Greene County, Ohio, (thesis).
Chik,Z., Islam, T., and Taha, M.R., 2011. Implemented in awide variety of geotechnical investigations, including pavements, solid waste landfills, and sea beds profile, Tamkang Journal of Science and Engineering, Vol. 14, No. 2, pp. 107-114.
Dey,A.,2015.Subsurface Profiling using MASW: Aspects of Data Acquisition,Dispersion and Inversion Analyses (rep.). https://www.researchgate.net/publication/282002961) (accessed 08.12.15)
Grandjean ,G.,2009. From geophysical parameters to soil characteristics (rep.). http://eusoils.jrc.ec.europa.eu/public_path/Digisoil-D2.1 (accessed 11.12.15)
Godio,A., Bastani, M., French, H., Bloem, E., Foti, S., Arato, A., and Pedersen, L. , 2010. Optimisitaion of geophysical field methods (rep.) http://www.bioforsk.no/ikbViewer/Content/71116/version=1/SoilCAM_deliverable_D1.2 (accessed 07.09.16)
Hiltunen,D.R.,Hudyma,N.,Tran,K.T., and Sarno,A.I., 2012.Geophysical testing of rock and its relationthips to physical properties (rep.). http://www.fdot.gov/research/Completed_Proj/Summary_SMO/FDOT_BDK75_977-01_rpt(accessed 04.06.16)
Hamizah binti Mohamad, 2016. The study of Electrical resistivity imaging ( 2D and 3D) and Geochemical in the hot spring area at Pedas (rep.)
Kearey, P., Brooks, M., and Hill , I., 2002. An Introduction to Geophysical Exploration , Third Edition, Blackwell Science Publications.
Martin,A.J. and Diehl,J.G.,2004. Practical experience using a simplified procedure to measure average Shear-Wave velocity to a depth of 30 meters (Vs30), 13th world conference on Earthquake Engineering, Vancouver,B.C., Canada, August 1-6, 2004, Paper No. 952.
Downloads
Published
Issue
Section
License
Copyright @2019. This is an open-access article distributed under the terms of the Creative Commons Attribution-ShareAlike 4.0 International License which permits unrestricted use, distribution, and reproduction in any medium. Copyrights of all materials published in JGEET are freely available without charge to users or / institution. Users are allowed to read, download, copy, distribute, search, or link to full-text articles in this journal without asking by giving appropriate credit, provide a link to the license, and indicate if changes were made. All of the remix, transform, or build upon the material must distribute the contributions under the same license as the original.